for Energy Professionals
Smart meters provide interval energy use data on-line to many of your clients now. And often at no cost. makes it easy to add interval data analytics to your toolkit of services.
These analytics can be a "conversation starter" with clients by revealing unexpected insights into their operations (click each to expand):
identifies your most common usage patterns - when does your energy use "wake up" and "go to sleep"? When does it peak? Is there a weekend vs. weekday pattern? The office building shown here appears to have a typical profile.

But the Meter Insights report points out that over 90% of Saturdays and Sundays experienced a 12 hour increase in electricity use, starting between 8am - 9am. This was unexpected, and led to a simple controls change which saves over $6,000 per year.
Cooling equipment uses about 18% of total annual electricity use for this fitness club. The cooling system turns on when the outdoor temperature is 45°F (7.2°C) or higher, and cooling can occur any hour of the day.

determines how much of your energy use is driven by weather. The analysis calculated potential savings for this facility of over $14,000 per year from better thermostat controls and cooling system maintenance.
The electricity use for this college campus rose steadily over a year. This "load creep" is usually caused by new stuff (like computers and small refrigerators) or aging equipment like compressor motors which become less efficient over time.

The Meter Insights report for the college determined that load creep added 5% to the total annual electricity use for the college. Reducing the creep to a more typical rate would save almost $80,000 per year.
finds jumps in demand which occur at unusual times. The hourly electricity use for a high school seen here is within the expected range until about 6pm on a Thursday. It looks like something was turned on and left on for 12 hours.

The analysis identified more than 100 spikes like this over the past year, and reported that most occurred during late evening and early morning hours. These added over $2,000 to the school's electric bill.
determines how much of your energy use comes from equipment which is never turned off. This is often much larger than anticipated. calculates the potential savings from reducing this continuous load.

63% of annual electricity use in this facility is from equipment running 24x7. A 10% reduction would save an estimated $56,000 per year.
You may be on holiday, but is your building on holiday? identifies days over the past year when the energy use stayed low for most of the day. Electricity use for the industrial facility shown here dropped to the 24x7 level for three days starting on Thanksgiving.

Note the small bump in use on Friday morning following Thanksgiving. The Meter Insights report lists all "shutdown" days so you can see if your facility is still operating when its occupants are not.
And if you use interval data in your work now, let extract additional value for your clients from a resource you already have.
What you get
provides two options for incorporating interval data analytics into your offering.
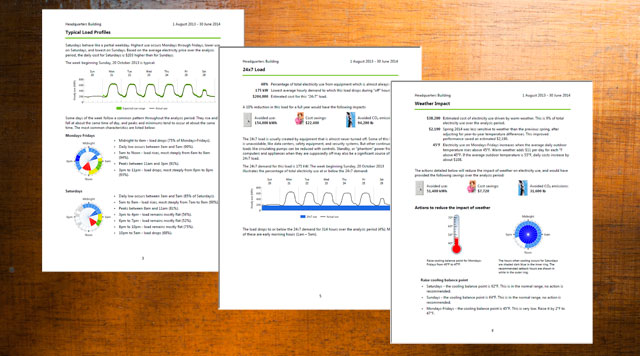
 The first is the Meter Insights report, a stand-alone analysis of 3-13 months of historic energy use white labeled with your logo. The report shows your clients how their facilities operate from their meter's perspective, in clear, non-technical language. Click here to see a sample report.
 The second option is a customized "data feed" of detailed results to be imported into your existing analytic tools. This might include hourly end use breakouts, or weather correlation coefficients, or unusual use spikes. The data feeds can be "one time only" or recurring as needed.
Easy, cheap, fast
You don't need any special software or hardware. Just tap the "SIGN-IN/REGISTER" link in the upper left corner of this page, and follow the directions to upload your clients' energy data. The Meter Insights report rebranded with your logo will be emailed to you, usually within 2 hours.
The cost for a report is US$20. And if the report does not provide valuable insights about your clients' energy use, it's free.
Where can I get my meter data?
Your local utility can usually provide this information, but submeters, data recorders, and energy management systems can also be used. If you are a customer of one the following utilities, then you can have them send your meter data directly to . Click on the utility name for details.
works with meter data in any format, from any source.
Data privacy
Your meter data is sensitive information. It can reveal occupancy patterns and other operational behavior. We NEVER share your data or analysis results with a third party without your EXPLICIT permission. Click here to view our full privacy policy.
You can anonymize the data that you upload to us by removing account numbers, addresses, facility names, etc. The only location information we need are the first 3 characters of your postal or zip code, which we use to select the nearest weather station for our analysis.
Data privacy
You can talk to a real live person at 510-847-6103. We're in California, so Pacific time zone business hours are best. Otherwise leave a message and we'll get back to you asap. Or check out our Frequently Asked Questions section. Or email us at support@energyai.com.
© Copyright 2026 ENERGYai®


