Meter Insights Features
When you first sign up for Meter Insights, we download your electric meter's most recent year of PG&E data. This is your energy use every 15 minutes, so we analyze over 35,000 readings to develop a personalized model for your business, including:
- day-of-week patterns: are there days of the week when energy use is highest, such as weekdays vs. weekends?
- hour-by-hour patterns: for each day of the week, when does your energy use "wake up" (rise) and "go back to sleep" (drop)?
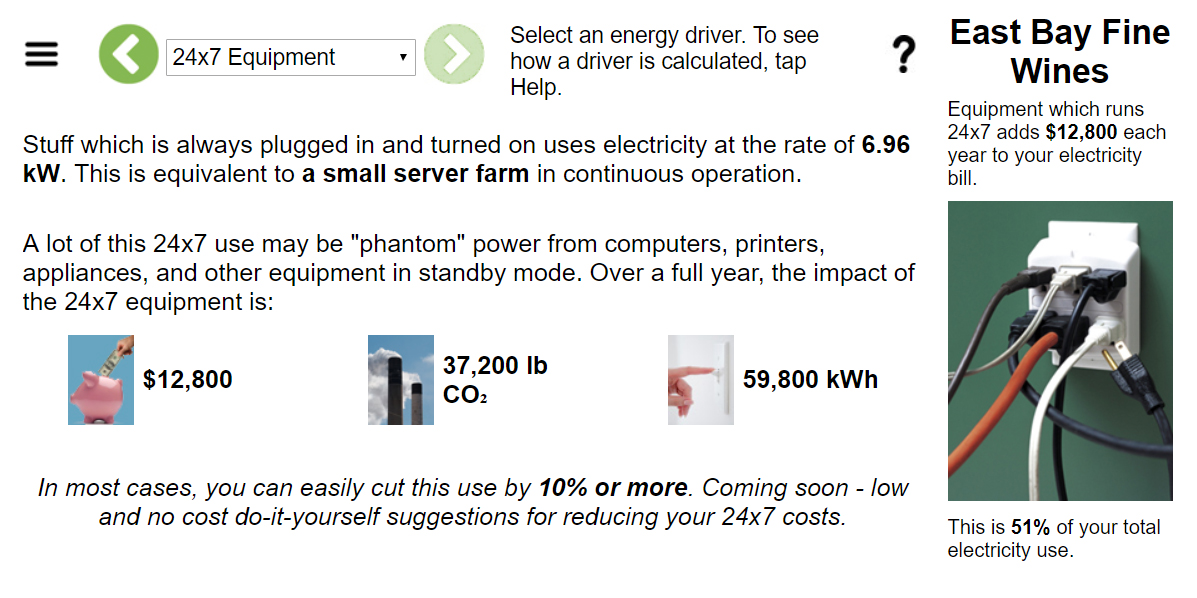
- 24x7 use: how much equipment is running 24x7, even when your business is closed for the day?
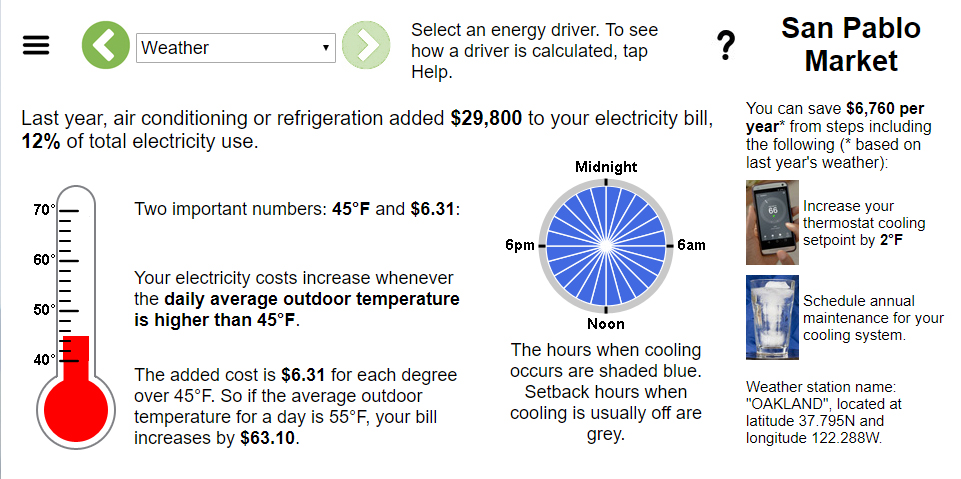
- weather impact: how does hot or cold weather affect your use?
- seasonal trends: are there long term trends in your energy use, caused by production cycles, occupancy patterns, or other drivers?
The model has a range in which your energy use is "expected" to be for every hour of the day. We call this the "expected use range". And it is unique to your business, it is not based on typical patterns for similar businesses (as if there is such a thing).
Alerts
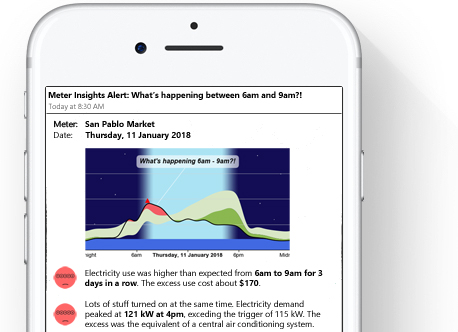
Meter Insights downloads your latest PG&E data each day, and sends you an email alert when it sees something unusual. Maybe your use was higher than expected between 6am - 9am for the last 3 days in a row, or the daily peak was higher than normal.
You're alerted about the timing, cost, and energy impact of unusual events. But sometimes you'll want to see more details. Just tap the "daily profile" graph in the alert. This takes you to the on-line Meter Insights world.
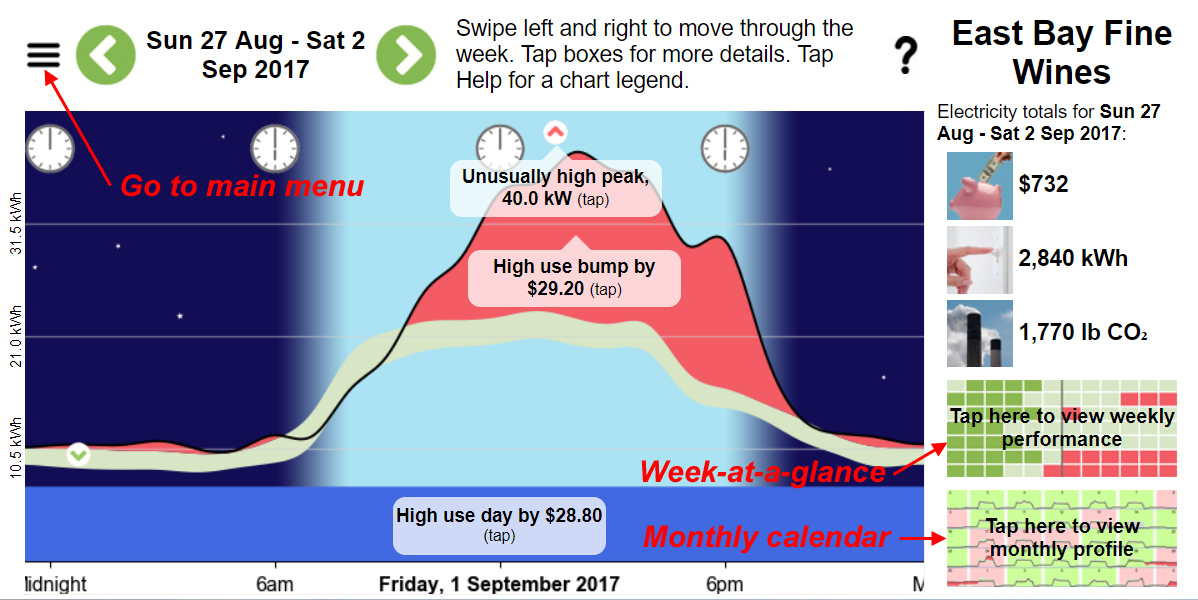
The daily profile shows the most recent meter data available from PG&E. You can see your actual use (the black line) and your "expected use range" (the gray band). Any periods of higher than expected use are in red (lower than expected are green). Your 24x7 use (from equipment which is always on) is the blue band at the bottom of the profile.
The profile is actually a seven day view, just swipe to the right to view earlier days. If you're viewing this on your computer, click on the daily profile and use the left and right arrow keys to scroll back and forth (or hold down the Shift key and scroll with your mouse wheel).
Other features in the daily profile include:
- White boxes highlight unusual events. Tap on a box for more information about the event.
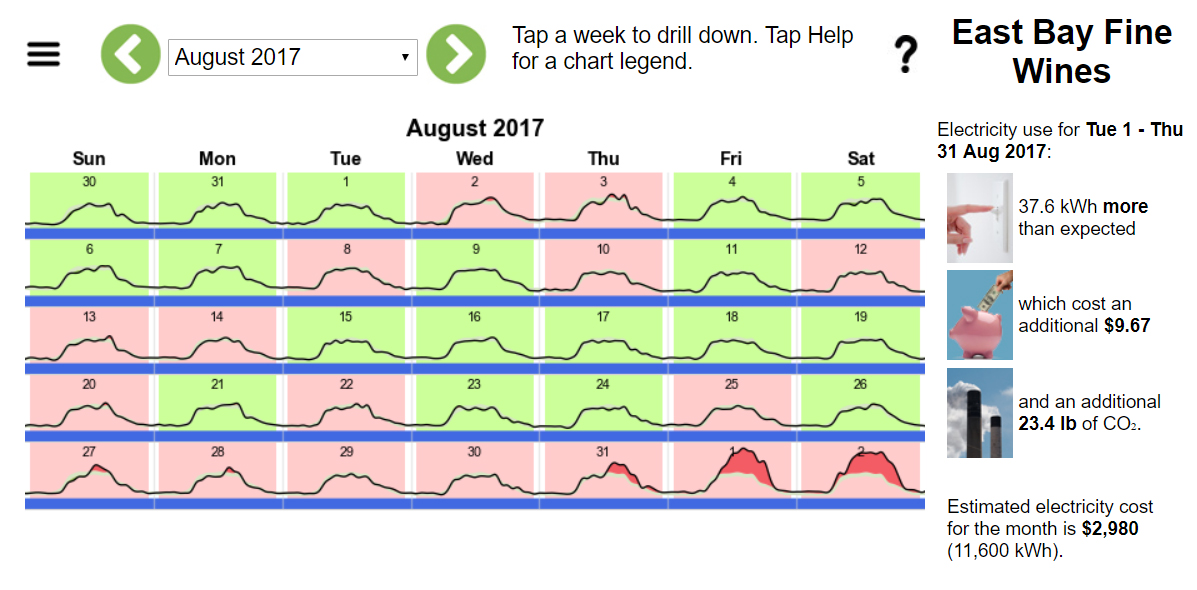
- Tap the monthly calendar icon in the lower right corner to see profiles for the full month. "Good days" (where daily use is less than expected) are green, "bad days" are pink. So you can see at a glance how your facility is trending. Tap on an earlier week to drill down to its profile.
- Tap the weekly performance icon for a "week-at-a-glance" overview of your performance vs. expected use.
- Tap the Main Menu icon for more Meter Insights, as described below.
Main Menu
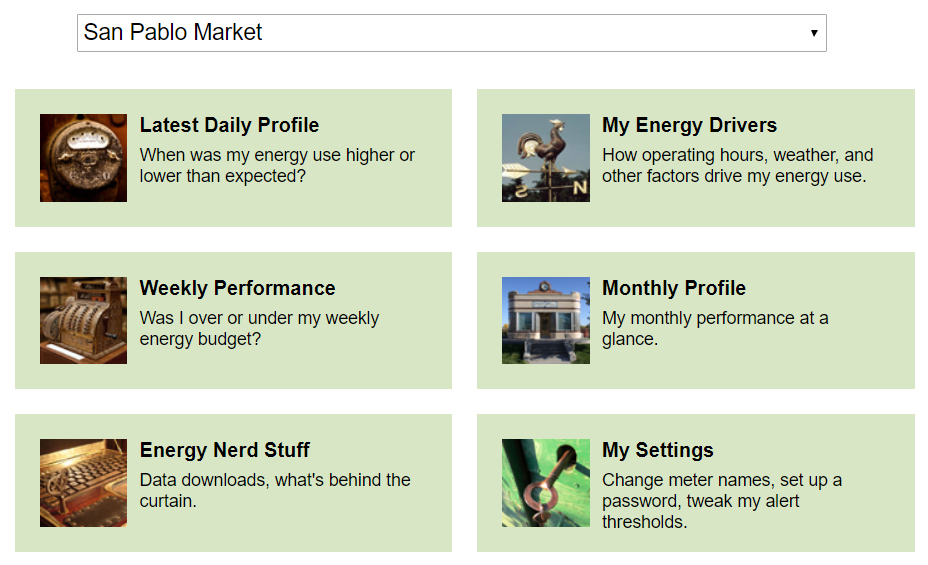
The Main Menu is your gateway to all of Meter Insights' on-line features. If you are sharing data for more than one meter, you can select the meter you wish to view at the top of the main menu.
"Latest Daily Profile" takes you back to the daily profiles. "My Energy Drivers" shows you the factors which have the biggest influence on your meter's energy use patterns.
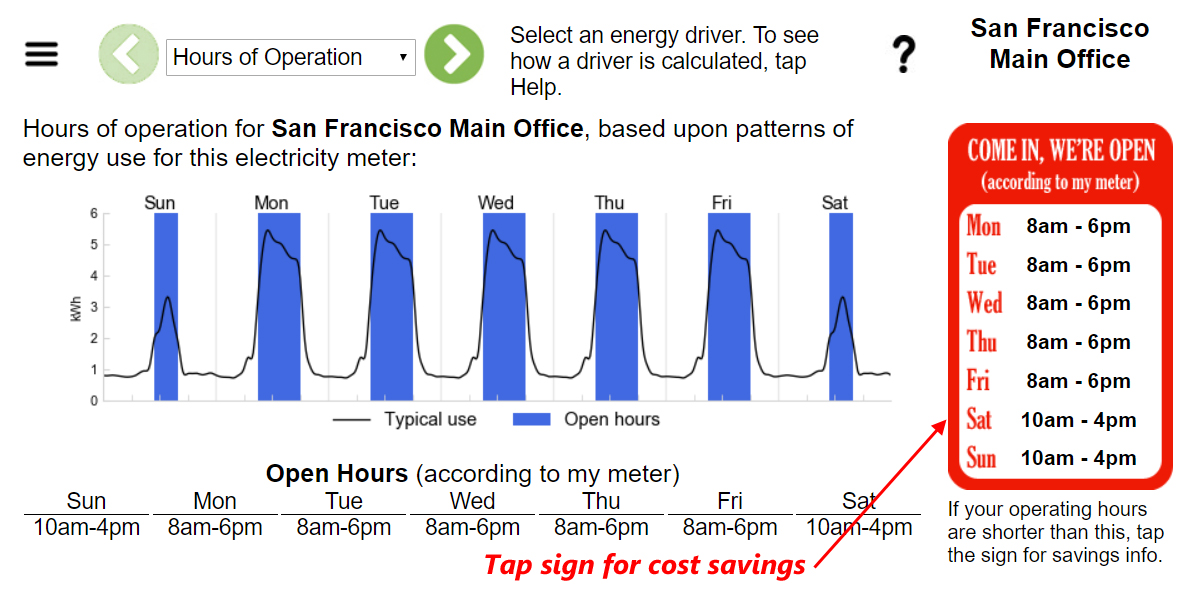
The first driver is "Hours of Operation". analyzes the meter's historic use patterns to identify those hours of the week when your energy use rises and falls. In other words, when does your meter think you are open for business or closed.
If your actual operating hours are shorter than this, tap the red "COME IN, WE'RE OPEN" sign to see what you might save in cost, energy, and CO2 by matching your energy use to your actual business hours.
Another driver is "24x7 Equipment" - how much equipment is continuously running, and what is this costing you.
Yet another driver is "Weather" - how hot or cold weather affects your energy costs. You might be surprised to learn that your air conditioning kicks in on days when the average temperature is as low as 45°F.
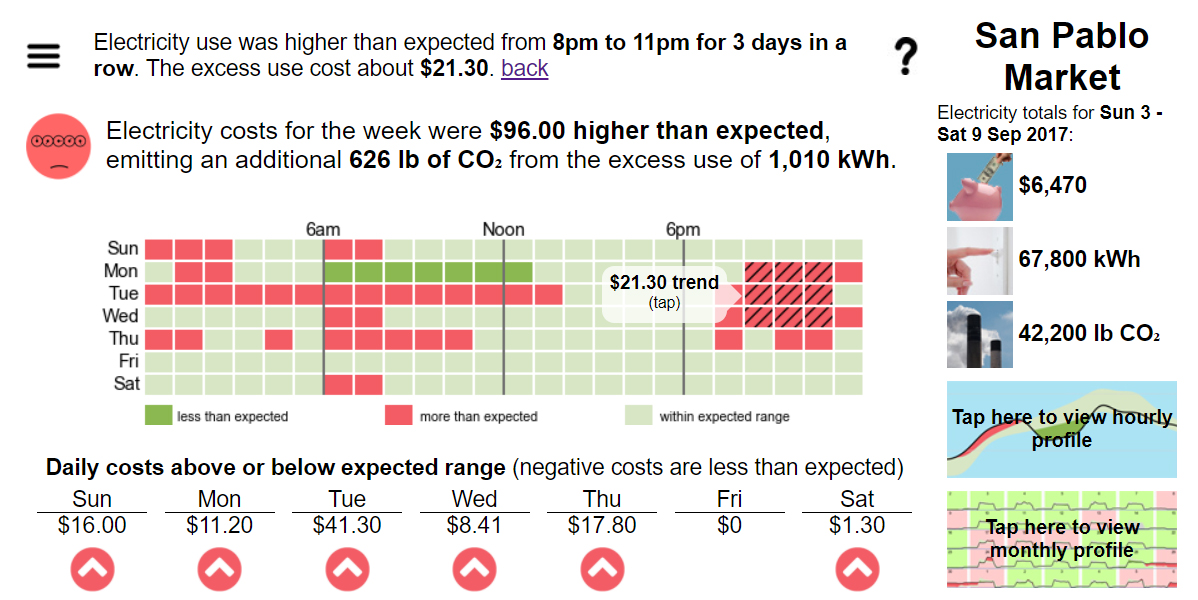
Back at the Main Menu, "Weekly Performance" shows a week at a glance. You can quickly see any emerging trends which may indicate equipment is getting left on longer than usual, or that maintenance may be required.
In the example shown here, equipment normally turned off at 8pm was left on for 3 days in a row, adding over $20 to the electric bill.
Also at the Main Menu, "Monthly Profile" shows your energy profiles for a full month.
Your energy use was less than expected on days with a green background, and higher than expected on days with a pink background. Daily use was within the expected range on days with a white background. You can tap on any week to drill down to a more detailed view.
Easy, cheap, fast
You can try Meter Insights for a month at no cost or obligation. If you're a PG&E customer, you already have everything you need, there's nothing to install. Sign up on line (takes 5 minutes) by tapping the "Free Trial" button below. You'll start receiving your insights in just a few hours.
If you wish to continue the service after the trial period, the cost is $5 per meter per month (volume discounts are available). And if you have an promo code (ask your energy contractor) you'll receive additional discounts.
Any questions?
You can talk to a real live person at 510-847-6103. We're in California, so Pacific time zone business hours are best. Otherwise leave a message and we'll get back to you asap. Or email us at support@energyai.com.
© Copyright 2026 ENERGYai®
