Today's Weather: Electric Bill Will Jump $500
Updated 12 June 2018
It's going to be nice in Cleveland today, with an average temperature of 75°F (23.9 °C). After a long winter and cool spring, the warm weather is a welcome change.
But for the cooling system in your client's building, this is just another day at the office. "Summer" started months ago. Any time the average daily outdoor temperature is 48°F (8.9 °C) or higher, the cooling system comes on.
And for every °F the average temperature is over 48°F, the facility uses an extra $19 of electricity (or $33 per °C over 8.9 °C). So our nice 75°F day will cost about $500.
2 things your clients should know about weather
Your clients probably know that hot (and cold) weather drive up their energy costs. But we've found that facility managers are often surprised when they learn two things about their buildings and weather:
 Balance point: the average daily outdoor temperature above which their cooling system turns on (or below which their heating system turns on). This is the "balance point", 48°F (8.9 °C) in our Cleveland example.
 Cost per degree: the added daily energy cost for each °F or °C the average temperature is above the balance point (or below the balance point for heating). This is the $19 per °F ($33 per °C) in our example. We call this the "cost per degree".
Commercial facility managers and occupants are usually surprised at how cold it is outside and yet their air conditioning turns on. At we've analyzed thousands of non-residential facilities whose energy use correlates with warm weather, and the median cooling balance point is 49°F (9.4°C). The range is 45 - 63°F (7.2 -17.2°C).
The "cost per degree" is also a real eye-opener. Facility managers often assume that short periods of extreme weather drive most of their heating or cooling energy use. A heat wave may trigger peak demand (and all the attendant charges), but the many more days of milder weather usually contribute the bulk of weather-related use.
Lots of factors determine the balance points and cost per degree for a facility: thermostat setpoints and setback schedules, internal gains from lights and other equipment, building size and construction, the overall efficiency of HVAC systems. And of course location (it's tough being a facility manager in Phoenix or Oslo).
But the good thing about having lots of factors is that there are lots of options to reduce a building's weather sensitivity, and some of them are no or low cost. That's a good way to start the conversation about next steps.
A look under the hood
A brief word on methodology. Correlating energy use and weather has been a standard energy analysis practice for many years. Here is a link to our favorite discussion of the basic approach.
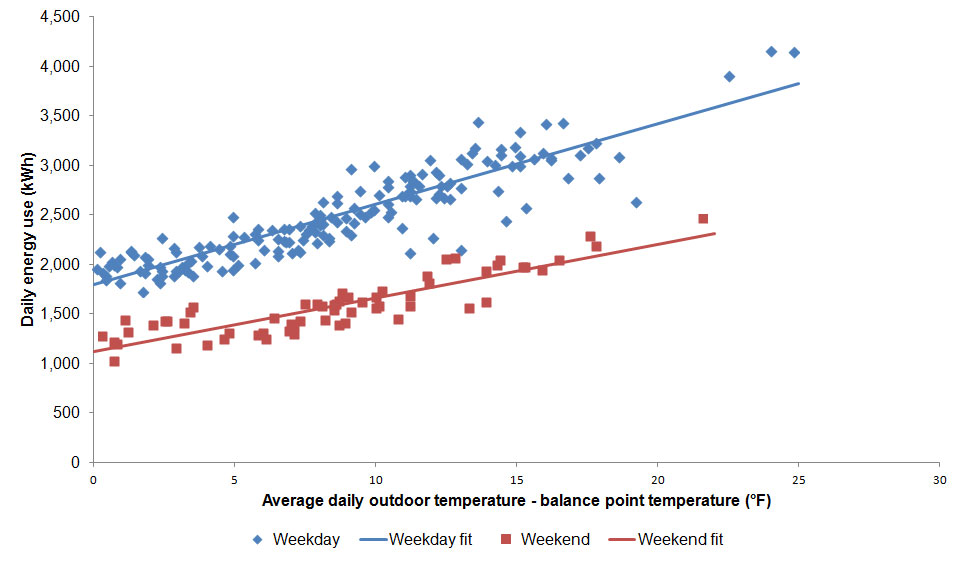
At , we use interval meter data to correlate daily energy use to average daily outdoor dry bulb temperature. If the facility has different energy use patterns for different days of the week (for example, weekend use is lower than weekday use), we analyze each day group separately. Here's an example from a commercial building with weekday vs. weekend patterns:
The balance point is determined by iteration to the best fit. The cost per degree is essentially the slope. In the above graph, the slope unit is kWh per ΔT, where ΔT is average daily outdoor temperature - balance point.
We convert kWh to cost using a variety of methods - average price from utility bills, modeling rate tariffs, or using regional average energy prices (earlier blog posts discuss good sources of retail energy prices in the U.S. here, and internationally here).
If it's the weekend, why am I working?
As mentioned earlier, we've analyzed the energy use patterns of a lot of buildings around the world. We thought it might be interesting to zoom in on those with high use on weekdays and lower use on weekends, to see how balance points and cost per degree vary.
We focused on cooling behavior. We assumed that operating hours would be lower on weekends, internal gains lower (lights and other equipment turned off), and perhaps thermostat setpoints would be higher than on weekdays.
These operational differences should mean that the balance point is higher, and the cost per degree is lower on weekends than on weekdays.
 What we found was a bit unexpected. Weekend balance points were higher on only 23% of buildings, and unchanged on 75%. They actually dropped on 2% of the facilities, including one which went from 61°F on weekdays to 51°F on weekends (16.1 to 10.6°C).
The change in cost per degree was a bit closer to our assumption. It dropped on weekends for 65% of the facilities. But it was unchanged for 7%, and increased on weekends for 28% of buildings. In one facility, the cost per °F went from just under $15 on Monday-Friday to over $22 on Saturday-Sunday, a 50% increase.
That sounds like a great opportunity to engage a client to investigate what is driving this unexpected behavior.
© Copyright 2026 ENERGYai®